
Earth Fire Alliance and Muon Space Release First Light and First Active Fire Images from Operational FireSat Constellation
The imagery package spans three continents and includes small fire detections and a multi-day record of a large fire captured by all three satellites in turn
SAN FRANCISCO and MOUNTAIN VIEW, Calif., Sept. 16, 2026 (GLOBE NEWSWIRE) -- Earth Fire Alliance (EFA) and Muon Space today released first light imagery and inaugural views of active fire from the first three operational FireSat satellites that reached orbit July 7. The images were collected approximately three weeks post launch by the advanced multispectral infrared instruments aboard all three satellites. The collection spans three continents and represents a range of fire types and sizes—from small, relatively cool hotspots to a large, intense fire.
This release marks a step change in global space-based wildfire detection and monitoring. While it’s not new to monitor wildfires from space, the multi-purpose systems currently relied upon don’t see fires with sufficient detail or frequency for many applications. The FireSat constellation, which was built for EFA by Muon Space specifically for early fire detection, detailed resolution, and rapid revisit, delivers both precision and cadence.
The first image the recently launched FireSats captured and sent back to Earth after reaching orbit—known as “first light”—is a view of Dubbo, New South Wales, Australia, and the surrounding area:
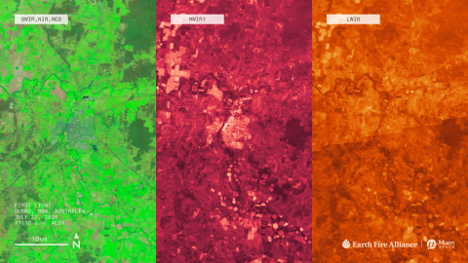
The SWIR/NIR/RED false-color composite (left) makes vegetation obvious: Irrigated farmland is bright green; woodland darker green; bare fields tan; the city of Dubbo blue-gray; and water dark blue. The midwave infrared band (middle) responds to both temperature and surface type. Warmer is brighter, but infrastructure, buildings, and crop patterns still show through. The longwave infrared (right) is a temperature map. In this daytime image, water and vegetation are the coolest surfaces and appear dark; bare fields and pavement are warmest and appear brighter.
In the same pass, FireSat detected several small, cool fires scattered across surrounding farmland that are associated with managed agricultural, hazard reduction, or cultural burns:
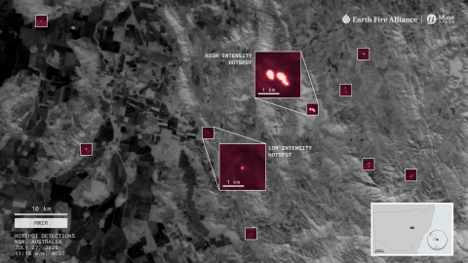
FireSat’s midwave infrared (MWIR) bands can detect fires as small as 5x5 m–about the footprint of two parking spaces. This unprecedented sensor sensitivity enables early detection, which is critical to prevent fires from escalating into widespread disasters.
The following day, the constellation detected a single hotspot in the hills of Portugal’s Porto District. EFA partners in the country confirmed this was the end stages of a small, regional wildfire:
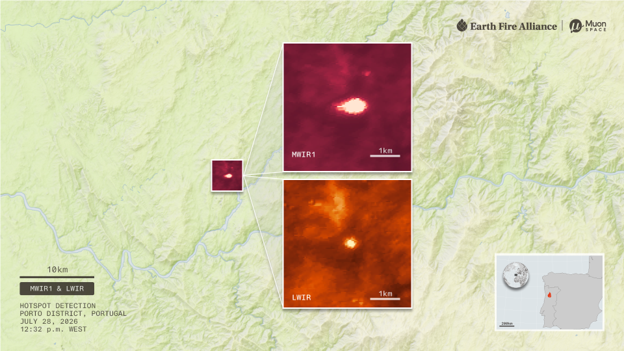
Combined, FireSat's midwave (MWIR1 - burgundy) and longwave (LWIR - orange) infrared bands can measure fire radiative power, which is critical to determine fire intensity and distinguish between managed and out-of-control fires.
Central to the imagery package is the Big Grass Fire along the Oregon-Idaho border in the United States. At the time of data collection, the fire had already burned 290,000 acres—about the size of Los Angeles. This fire involved grass, rangeland, heavy sagebrush, and scattered timber. Grass and shrub landscapes account for most of the land that burns in the U.S. Between 1990 and 2020, grass and shrubland fires burned more than twice the area of forest fires nationwide and accounted for nearly two-thirds of homes lost to wildfire. In the following image, each of the FireSat bands answers a different question—what vegetation is available to burn, where the front is, how intense the fire is, and what is still smoldering behind it:
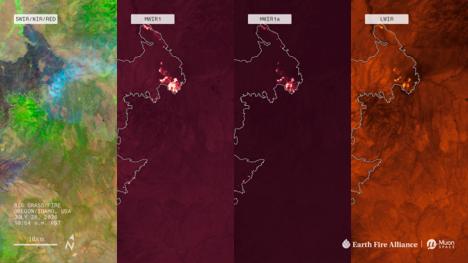
The SWIR/NIR/RED composite (far left) distinguishes vegetation from other types of land cover, which is important for predicting the progression of a fast-moving fire. The MWIR1 band (second from left) sees through smoke and detects fires that are small or relatively cool, which is essential for early detection. The MWIR1a band (second from right) is deliberately less sensitive to prevent oversaturation, like eclipse glasses for looking at the sun. Where MWIR1 saturates solid yellow, MWIR1a maintains detail, enabling the hottest parts of the fire to be precisely measured, but retaining the ability to detect new fire starts and reignitions. LWIR (far right) reveals temperature across the scene, including smoldering areas, cloud cover, and differentiation between cool forest and hot bare soil. LWIR also helps prevent false alarms such as heat signatures from sunlight glinting off bright surfaces like solar panels.
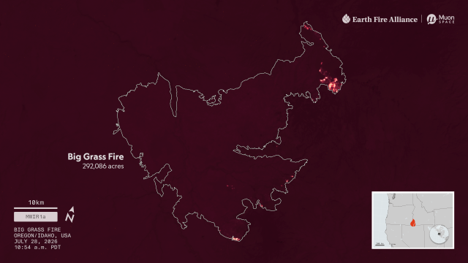
The entire Big Grass Fire as of July 28, 2026, captured by FireSat’s MWIR1a band. The most active regions were concentrated along the Eastern perimeter of the fire, particularly in the Northeast (upper right) where many hot, bright pixels are visible.
The three FireSats captured five views of an active front in the Big Grass Fire over three nights and two days, illustrating the power of a more frequent revisit rate:
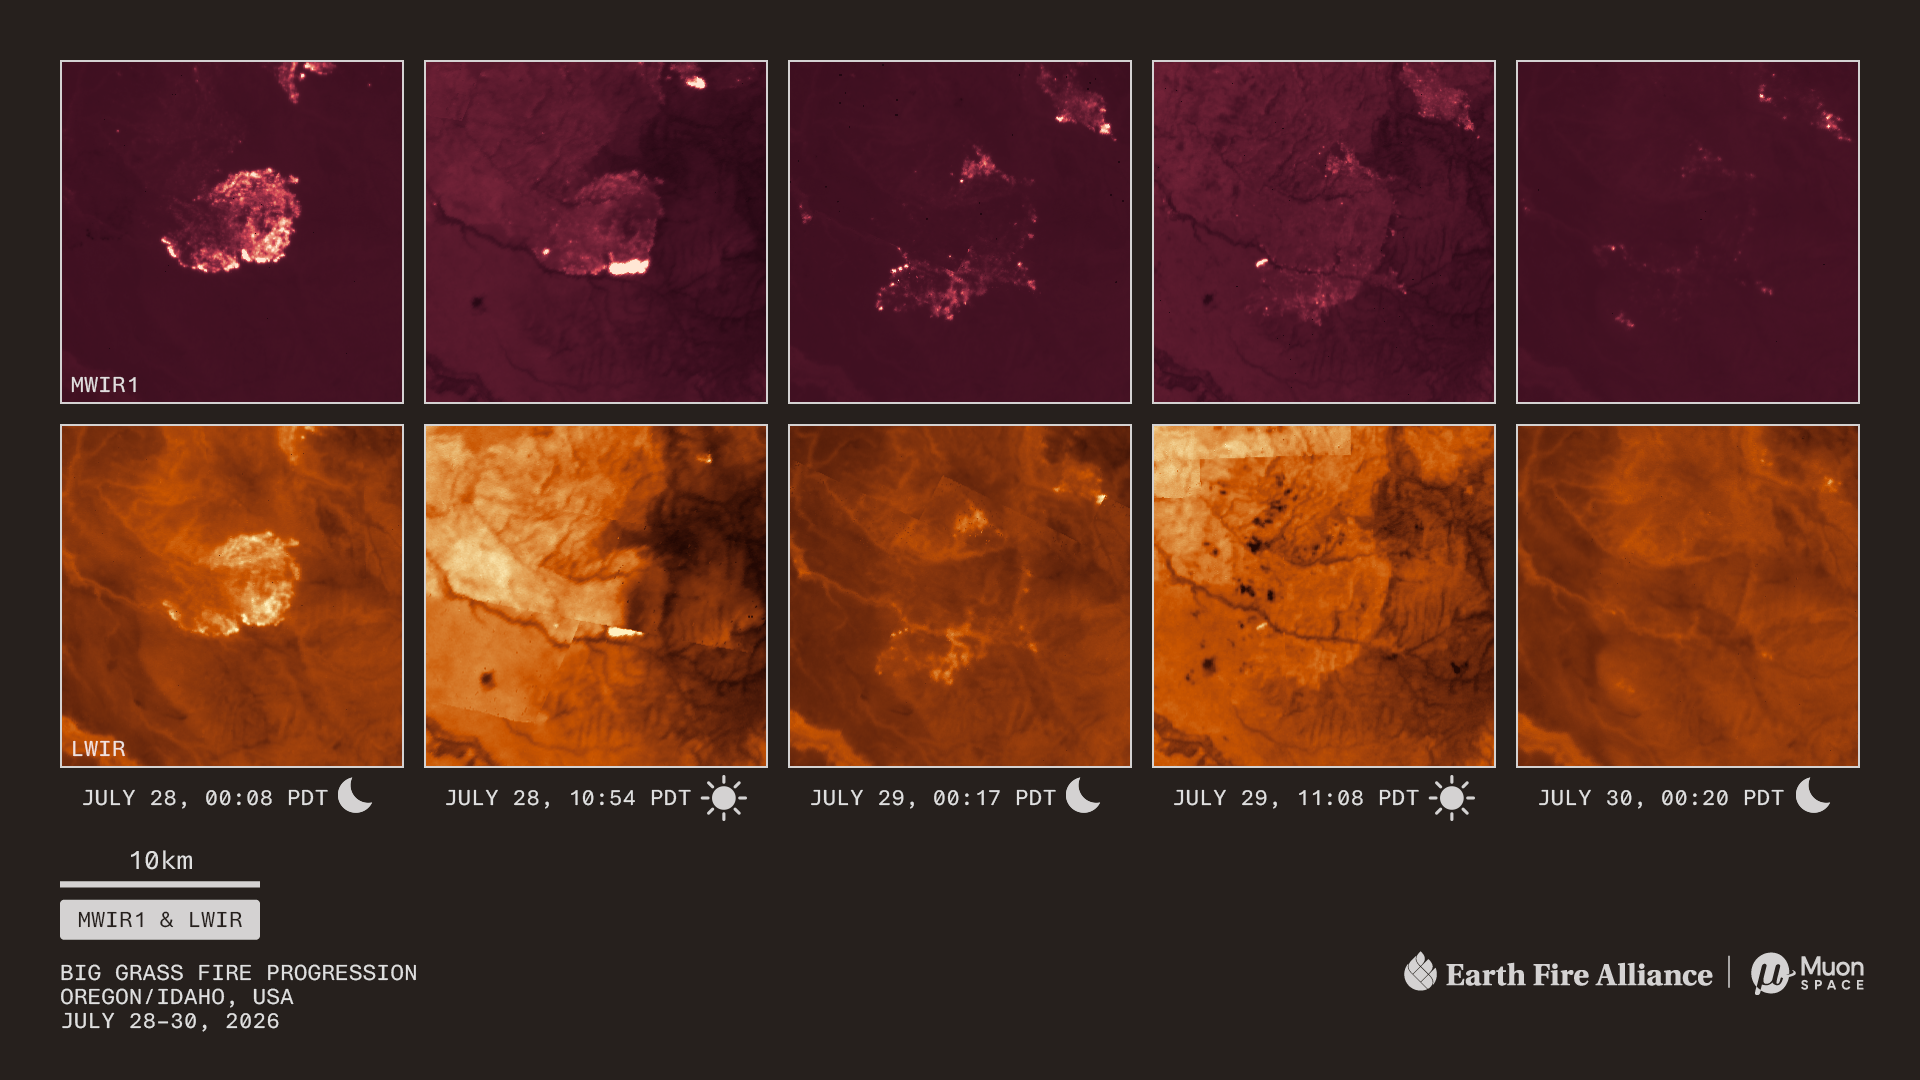
Shortly after midnight on July 28, the front was scattered across a broad area. By late morning it had concentrated along the Owyhee River, visible as a dark line from left to right. The front weakened overnight, and by July 30 only faint hotspots remained visible in the area.
"These images would not be possible without the support of philanthropists who funded this technology, dedicated engineers who built a sophisticated instrument dedicated to the fire community, and fire agencies and scientists who took the time to share their needs," said EFA Executive Director Brian Collins. "Because of them, we can now detect fires that were otherwise undetectable from space and watch how a fire behaves over time, at a resolution detailed enough to see the front move and evolve. That's the critical difference between knowing a fire exists and understanding what it will do next."
EFA and Muon Space launched the FireSat Protoflight demonstration mission in March 2025, which validated the system architecture and returned valuable sample datasets to inform iterative design.
"Protoflight proved that FireSat can detect and track fires from space with the speed, precision, and sensitivity we designed it for," said Muon Space CEO Jonny Dyer. "Now we're taking that capability from a single satellite to an operational constellation. With these first three satellites, FireSat begins the path toward a global system that gives communities and first responders the information they need to catch wildfires early and act before they become catastrophic."
What’s Next
The three FireSats launched in July are in commissioning, and operational FireSat data will be delivered to EFA’s Early Adopters—fire agencies and scientists across the world’s most fire-prone geographies—at least twice daily by the end of 2026. Data availability will expand throughout 2027 to support fire science and wildfire resilience activities, with global access anticipated by 2028. The FireSat constellation is expected to achieve an hourly global revisit by 2029 and a 20-minute revisit rate in the early 2030s.
EFA's FireSat program is the product of public-private-philanthropic partnerships. The Bezos Earth Fund, Google.org, the Gordon and Betty Moore Foundation, the Patrick J. McGovern Foundation, and others funded the constellation’s development. EFA’s worldwide network of partners and Early Adopters, including Google Research and the Environmental Defense Fund, contributed to the early technological innovation that led to this milestone.
About Earth Fire Alliance
Earth Fire Alliance (EFA) is a global nonprofit coalition building the technological infrastructure the world needs to detect, monitor, and understand fire—and delivering critical data to the firefighters, scientists, and communities who need it most. EFA’s flagship program, FireSat, is an advanced satellite constellation designed specifically to address the global wildfire challenge: generating an unprecedented dataset on fire and its effects on people and the planet. EFA partners with operational agencies, scientists, and technologists across continents to make fire data globally accessible, actionable, and available for the public good. To learn more, visit www.earthfirealliance.org.
About Muon Space
Muon Space is the Mission Foundry, designing, building, and operating high-performance satellite constellations for defense, civil, and commercial customers. Founded in 2021, the company has engineered every layer: spacecraft, instruments, software, and operations, all designed to work together from simulation to orbit. With advanced production facilities in Silicon Valley and multiple constellations already on orbit, Muon delivers in months, not years. For more information, visit: https://www.muonspace.com/.
Photos accompanying this announcement are available at:
https://www.globenewswire.com/NewsRoom/AttachmentNg/56313562-56cd-42e1-9522-3f0858180fef
https://www.globenewswire.com/NewsRoom/AttachmentNg/88b34bf9-33c3-4398-abd2-2979922f6bc5
https://www.globenewswire.com/NewsRoom/AttachmentNg/5255837a-62cb-47fb-99e2-e3c94ada126b
https://www.globenewswire.com/NewsRoom/AttachmentNg/e0e23d89-2a2f-4eb1-ac37-9d752eaa792d
https://www.globenewswire.com/NewsRoom/AttachmentNg/4729801f-9684-4f44-80c1-ef228fceee4b
https://www.globenewswire.com/NewsRoom/AttachmentNg/39357282-222c-4dcc-afa0-ed2f20e3a85d

Earth Fire Alliance Media Contact: Kristin Q. Cody, press@earthfirealliance.org
Muon Space Media Contact: Michael Sias, comms@muonspace.com

First Light: New South Wales, Australia
The SWIR/NIR/RED false-color composite (left) makes vegetation obvious: Irrigated farmland is bright green; woodland darker green; bare fields tan; the city of Dubbo blue-gray; and water dark blue. The midwave infrared band (middle) responds to both temperature and surface type. Warmer is brighter, but infrastructure, buildings, and crop patterns still show through. The longwave infrared (right) is a temperature map. In this daytime image, water and vegetation are the coolest surfaces and appear dark; bare fields and pavement are warmest and appear brighter.
Hotspot Detections: Australia
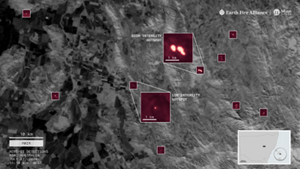
FireSat’s midwave infrared (MWIR) bands can detect fires as small as 5x5 m–about the footprint of two parking spaces. This unprecedented sensor sensitivity enables early detection, which is critical to prevent fires from escalating into widespread disasters.
Hotspot Detection: Portugal
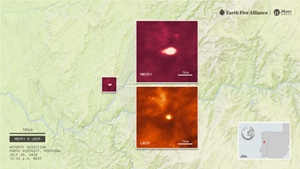
Combined, FireSat's midwave (MWIR1 - burgundy) and longwave (LWIR - orange) infrared bands can measure fire radiative power, which is critical to determine fire intensity and distinguish between managed and out-of-control fires.
Big Grass Fire: Western U.S.
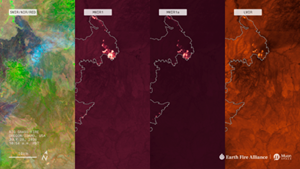
The SWIR/NIR/RED composite (far left) distinguishes vegetation from other types of land cover, which is important for predicting the progression of a fast-moving fire. The MWIR1 band (second from left) sees through smoke and detects fires that are small or relatively cool, which is essential for early detection. The MWIR1a band (second from right) is deliberately less sensitive to prevent oversaturation, like eclipse glasses for looking at the sun. Where MWIR1 saturates solid yellow, MWIR1a maintains detail, enabling the hottest parts of the fire to be precisely measured, but retaining the ability to detect new fire starts and reignitions. LWIR (far right) reveals temperature across the scene, including smoldering areas, cloud cover, and differentiation between cool forest and hot bare soil. LWIR also helps prevent false alarms such as heat signatures from sunlight glinting off bright surfaces like solar panels.
Big Grass Fire MWIR1a: Western U.S.
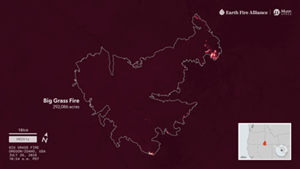
The entire Big Grass Fire as of July 28, 2026, captured by FireSat’s MWIR1a band. The most active regions were concentrated along the Eastern perimeter of the fire, particularly in the Northeast (upper right) where many hot, bright pixels are visible.
Big Grass Fire Progression: Western U.S.
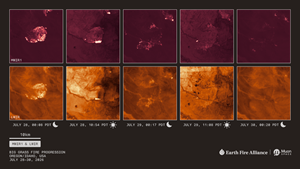
Big Grass Fire Progression: Western U.S. - Five looks at the same fire front over three nights and two days, captured by all three FireSats. Shortly after midnight on July 28, the front was scattered across a broad area. By late morning it had concentrated along the Owyhee River, visible as a dark line from left to right. The front weakened overnight, and by July 30 only faint hotspots remained visible in this area.
Legal Disclaimer:
EIN Presswire provides this news content "as is" without warranty of any kind. We do not accept any responsibility or liability for the accuracy, content, images, videos, licenses, completeness, legality, or reliability of the information contained in this article. If you have any complaints or copyright issues related to this article, kindly contact the author above.
